
It had to be the image of a waterfowl.
Of all the things to portray the impact solar energy has made on traditional power generation, it had to be this large bird — in particular, the curving outline of a duck with its dipping belly and rising neck — that has clearly shown how solar energy has changed the traditional rhythms of power generation.
This is the peculiar story of the “duck curve.”
Naturally, with increased daylight comes the potential for increased solar energy production. As late spring/early summer has arrived, along with extended periods of sun, solar energy has been especially effective at flooding the energy market and helping meet the total demand for energy. This especially happens during prime sunlight hours: typically 8 a.m. – 4 p.m. During this period known as the “duck curve,” this solar production has also translated to the falling of overall energy prices.
Take a look:
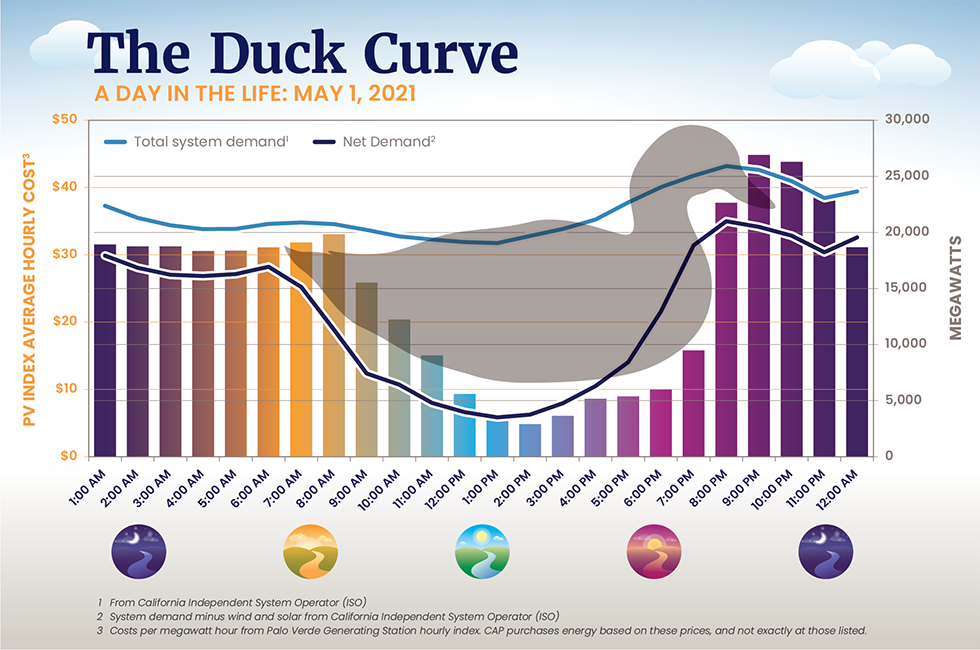
Simply, as solar generation helps meet demand of conventional energy, prices during these sun-soaked blocks of time plummet.
This is the period that electricity demand climbs and power generation ramps up. Due to this daytime solar production, less conventional energy is needed. Hence, the dip that is the duck curve.
It is a milestone happening in the history of power generation.
A landmark happening
In terms of the power grid, the “duck curve” has been a phenomena regarding the impact of solar energy on power generation.
For decades, the patterns of power generation ramping up and down along with electricity demands in order to control power output remained steady. Before the impact of solar during these hours, the power load was climbing during these “duck curve” periods with the peak loads remaining between 7-9 p.m., depending on the time of year. Solar power, and the excess solar production that drives prices down during this same period, has shattered this pattern.
CAP, meanwhile, adjusts its power operating strategy to capitalize on duck curve prices in order to help save water users money.
How CAP is ducking high power prices
During this time of year, CAP, the largest, single power user in Arizona, typically leaves some energy unpurchased to take advantage of these negative “duck curve” spot prices. They are only options in the day-ahead market when supply is forecast to be larger than demand.
Leaving these hours unpurchased for remaining energy needs is part of CAP’s general yearly energy acquisition plan, one way CAP seeks to save customers money and maintain secure and reliable deliveries. Another example: Mark Wilmer Pumping Plant in Lake Havasu, the first plant in the CAP system that lifts water 824 vertical feet and accounts for more than 50-percent of CAP’s energy use, pumps during these cheaper “duck curve” hours.
Tapping into renewable supplies such as solar to diversify power production sources is not new at CAP: Early last year, CAP had already diversified its power portfolio with solar energy.
So the next time you’re outdoors, perhaps enjoying wildlife and maybe even ducks flittering from the sky to splash on pond, impress your friends: tell them all about this unique concept of power known as the “duck curve.”