

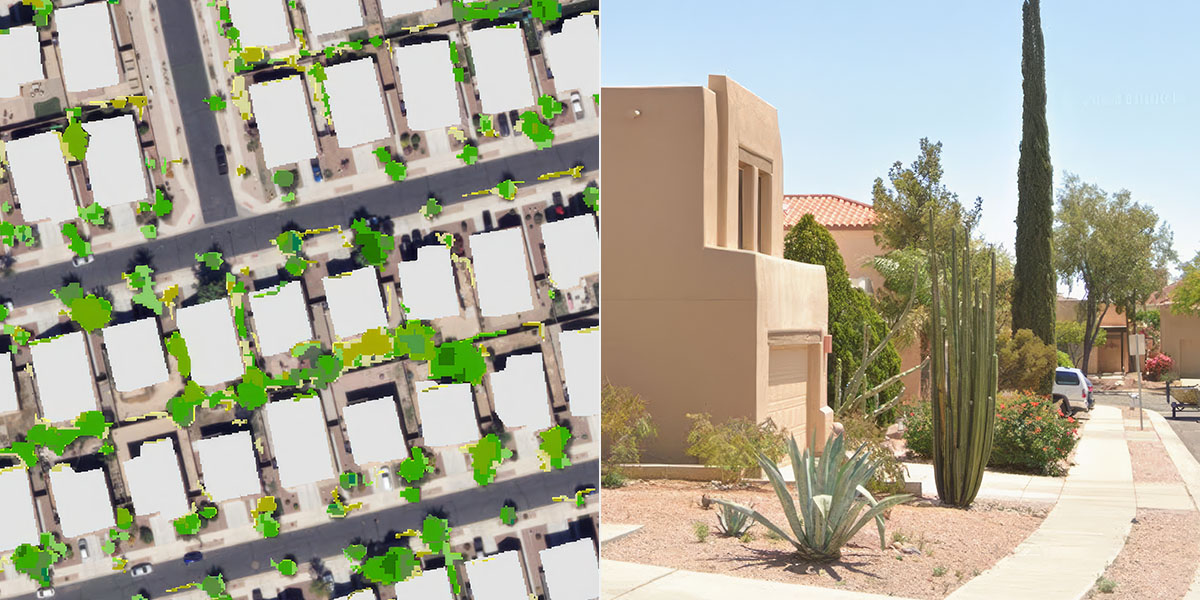
Understanding how water is used across central Arizona begins with understanding the landscape itself. That’s the goal behind the interactive land-use classification tool developed by Central Arizona Project (CAP), which gives water providers and planners a regional view of urban land use and the features that influence water demand such as grass, trees and swimming pools.
The tool is best explained via a story map. Those interested in using the tool can explore an interactive map, get answers to basic questions about water use and download data to support planning efforts.
“You can’t understand the future if you don’t understand what you currently have,” says Karen Fisher, data platform architect. “What’s different about our land-use classification tool is that it’s regional, rather than looking only at the smaller areas individual water providers typically study.”
That broader view helps agencies identify trends that would otherwise be difficult to see. As communities continue to grow, planners can compare changes over time, including new developments, changes in landscaping and the addition or removal of swimming pools, to better understand how development affects water demand.
“As you project growth across the Valley, you can understand the trends of what people are doing. That’s very helpful,” says Fisher.
Creating the tool and resulting story map required several months of technical work. The team developed a detailed urban land-use classification using high-resolution imagery and LiDAR data to distinguish between different landscape features. The technology can even differentiate grass from trees, allowing researchers to better estimate outdoor water use since different types of vegetation have different irrigation needs.
The resulting dataset has become more than a map – it’s a planning tool.
Water providers can focus their conservation efforts on specific areas where water is being used heavily. Neighborhoods and parcels can be identified, and conservation can be targeted to those areas.
The information is already being used by water providers to identify neighborhoods with strong conservation potential, monitor new development and support local land-use classification efforts. CAP also shares the data through an online portal, allowing participating agencies to download datasets and build on the work for their own planning needs.
The project reflects Arizona’s ongoing commitment to making the most of its limited water supplies.
The tool can also evolve as new data becomes available. With updated federal imagery and additional land-use data now being released, the project team can continue expanding the resource and providing new insights into how the region is changing.
Ultimately, the tool and its story map serve as both a snapshot of today’s landscape and a foundation for tomorrow’s water planning, giving water providers the information they need to make informed conservation decisions while helping communities prepare for future growth.