Super El Niño? What could that mean for the Colorado River?
Share this post
By Orestes Morfin, Senior Policy Analyst
El Niño is often portrayed as a predictable event that has the same effect whenever it appears. In reality, however, the effects of El Niño are not guaranteed, and this winter’s competing oceanic and atmospheric cycles are a perfect example of that. Context matters – none of these cycles is happening in isolation and the way in which they interact can make or break expectations.
So, let’s break it down by looking at the ocean, the atmosphere – and the complicating factors.
What happens in the ocean during El Niño?
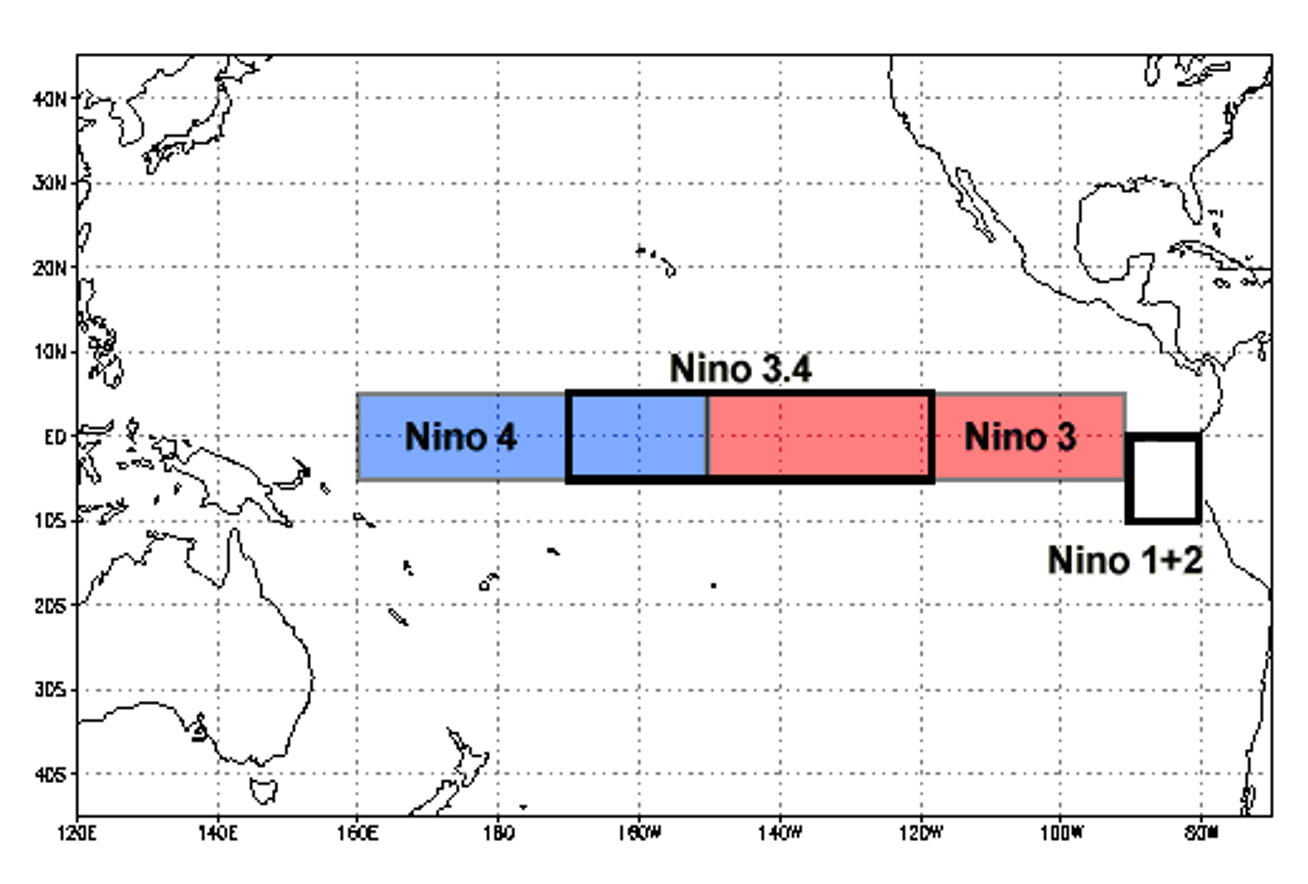
El Niño is a seasonal pattern: it persists over several months. Defined by the trend in sea surface temperature anomaly (SSTA, or “how different current temperatures are from the long-term average”) in the “El Niño 3.4” region of the Tropical Eastern Pacific Ocean, it is primarily an oceanic phenomenon.
Figure 1 – The El Niño 3.4 region (https://www.ncei.noaa.gov/access/monitoring/enso/sst)
What happens in the atmosphere during El Niño?
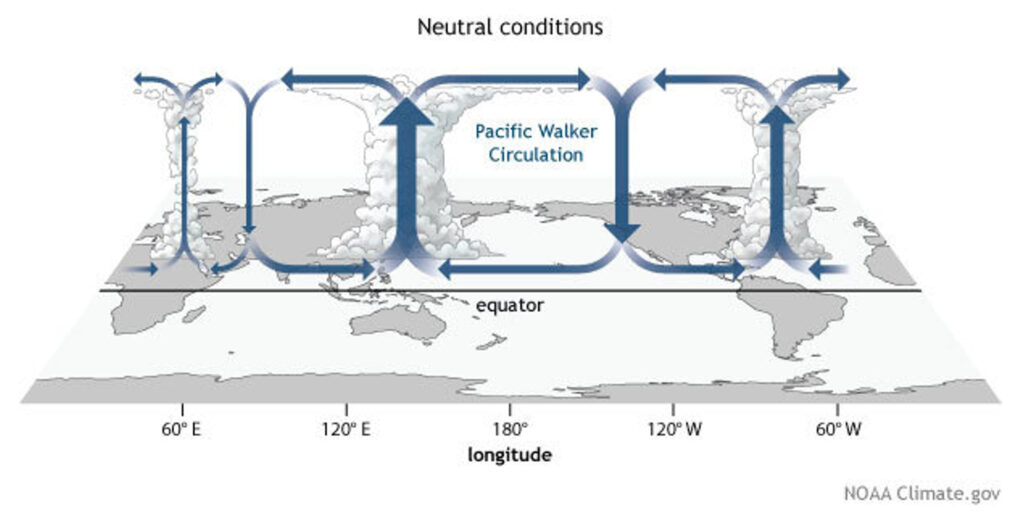
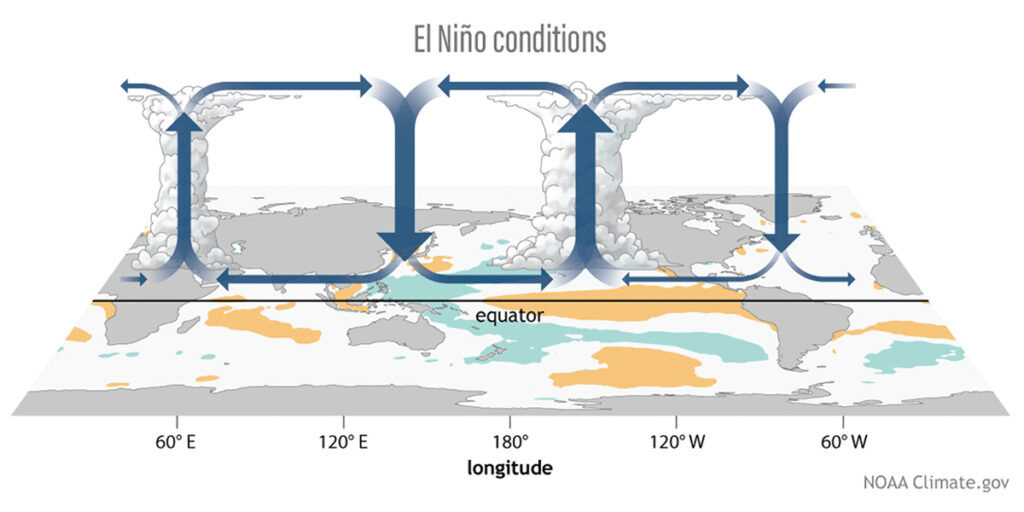
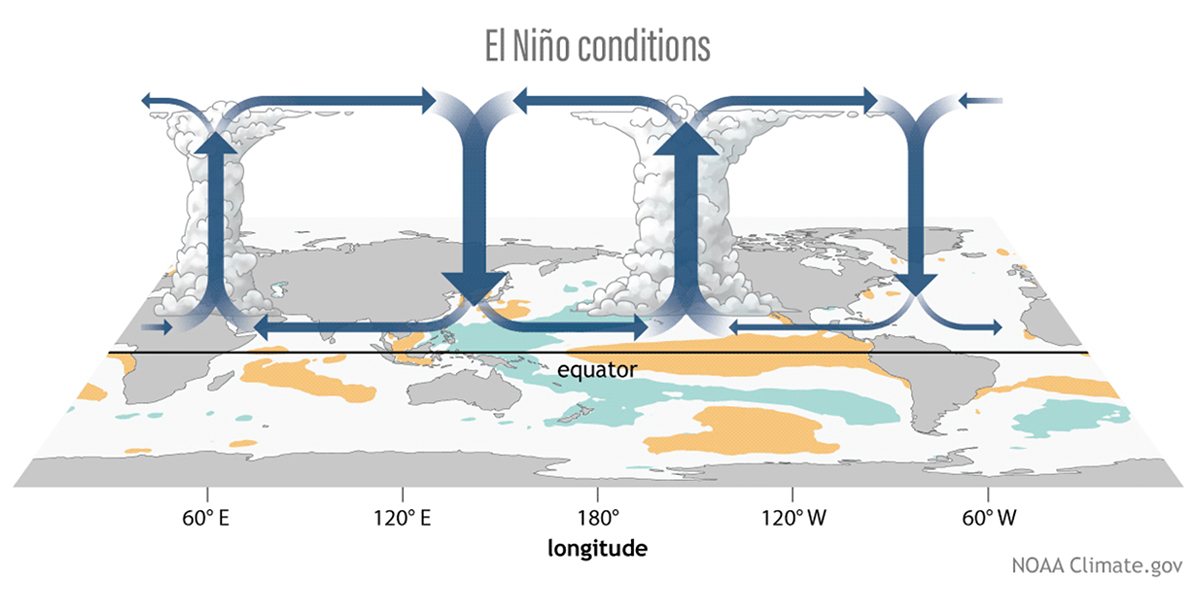
In what we think of as a “classic” El Niño, the atmosphere syncs up (“couples”) with the ocean. The tradewinds weaken and may even stall, stranding a mass of warmer-than-average surface water along the Equator in the eastern Pacific. The cycle the tradewinds follow across the equatorial Pacific is known as the Walker Circulation (Figure 2). In a “classic” El Niño, this entire pattern shifts eastward.
Figure 2 – The Walker Circulation in “neutral” (top) and “classic” El Niño conditions (bottom) (https://www.climate.gov/news-features/blogs/enso/walker-circulation-ensos-atmospheric-buddy)
What makes this year a “Super El Niño”?
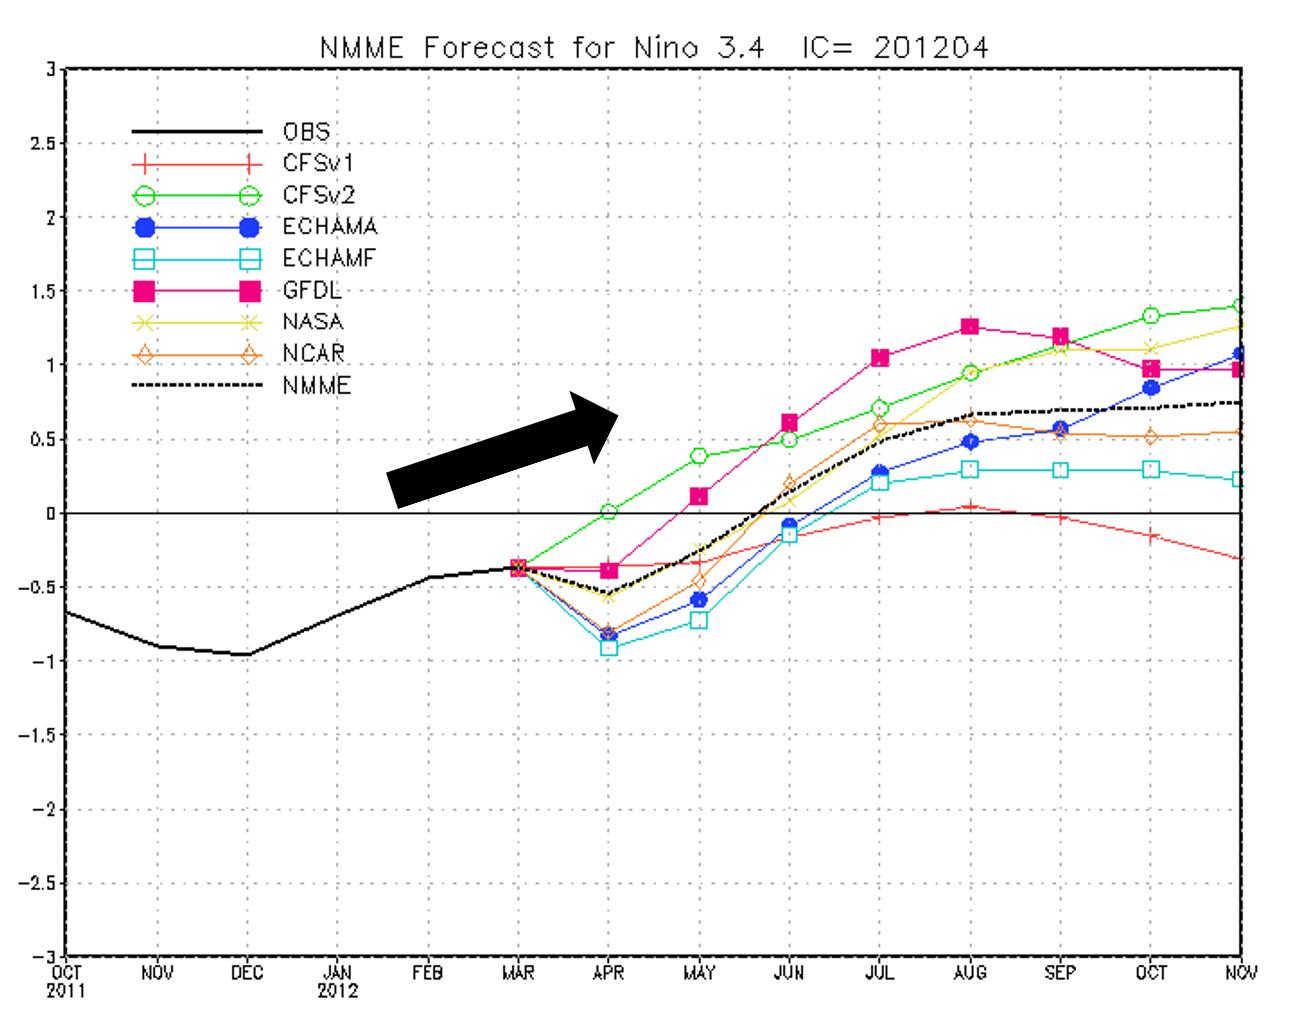
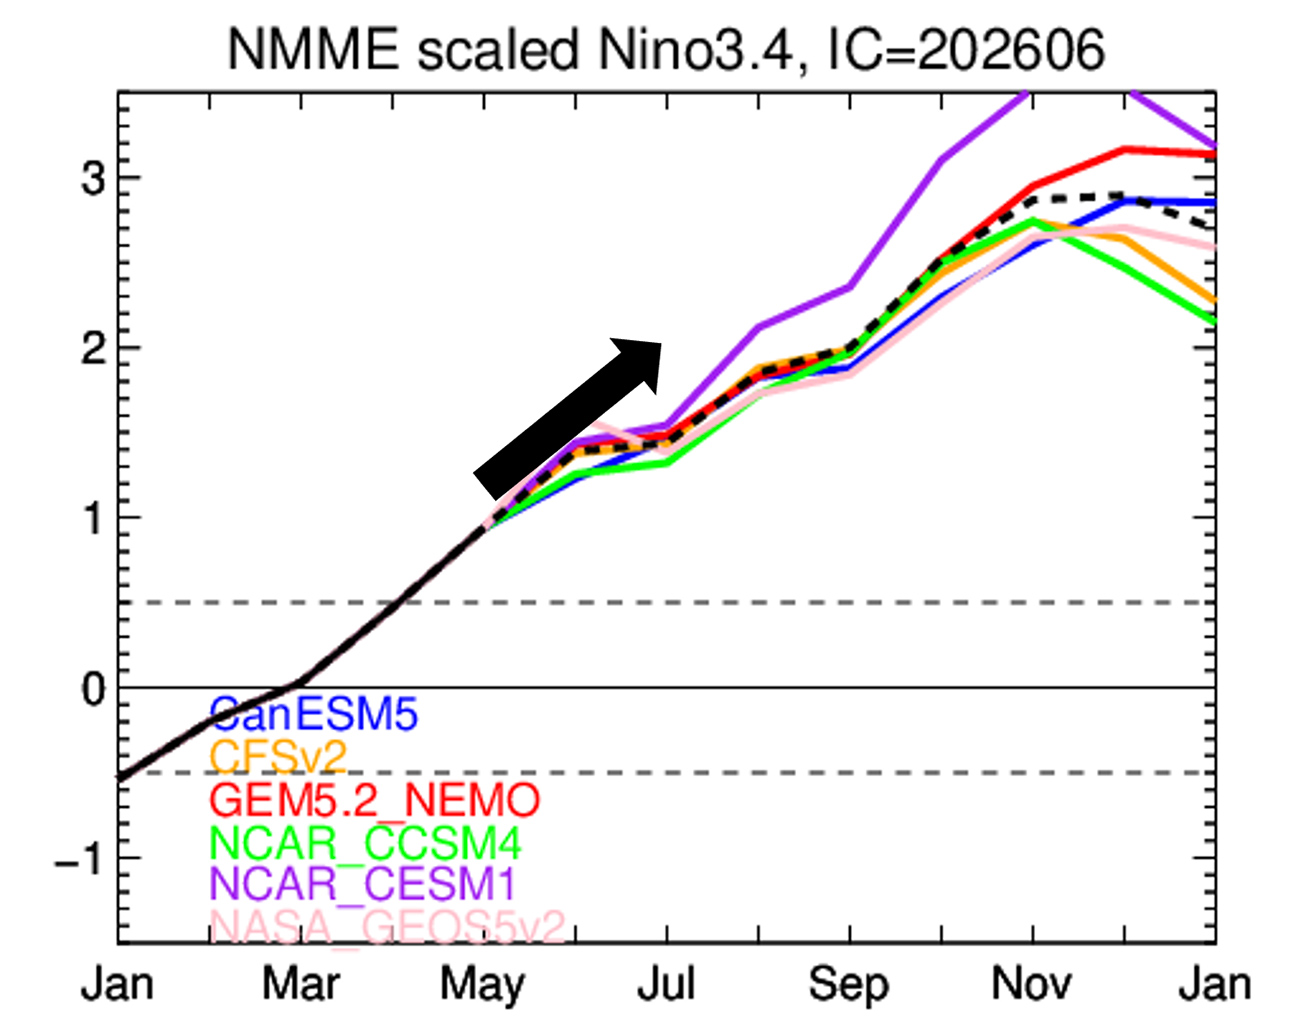
The designation of “Super El Niño” has partly to do with the expected magnitude of the shift in SSTA, but also with the expected speed of that shift. If predictive modeling shows an expected change in SSTA of less than +2.0°C, then the event is deemed an “El Niño” (Figure 3).
If predictive modeling shows an expected change in SSTA greater than +2.0°C, however, then the event is deemed a “Super El Niño.” (Figure 4).
Figure 3 - "Classic" El Niño (https://www.cpc.ncep.noaa.gov/products/NMME/archive/2012040800/current/images/nino34.ENSMEAN.png)
Figure 4 "Super El Niño" (https://www.cpc.ncep.noaa.gov/products/NMME/current/plume.html)
What can we expect from El Niño?
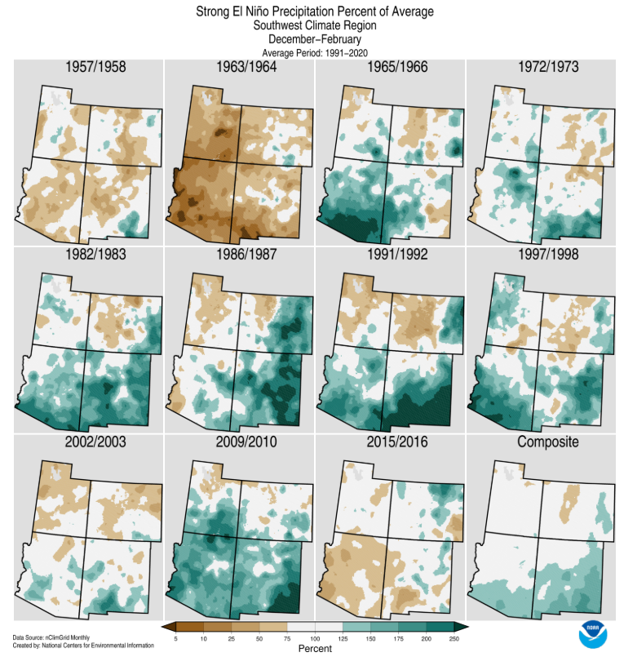
Classic El Niño years have historically meant wetter winters for the Southwest and warmer, drier winters for the Pacific Northwest and northern continental US. (Figure 5).
Figure 5 - Winter precipitation percentage of average in strong El Niño years (https://www.ncei.noaa.gov/access/monitoring/dyk/el-nino)
However, judging from the occasional “drier than average” winters in the Southwest shown in Figure 5, El Niño is complex and its outcomes are not guaranteed. This may be due to other complicating factors. Other phenomena that may have an effect on El Niño include:
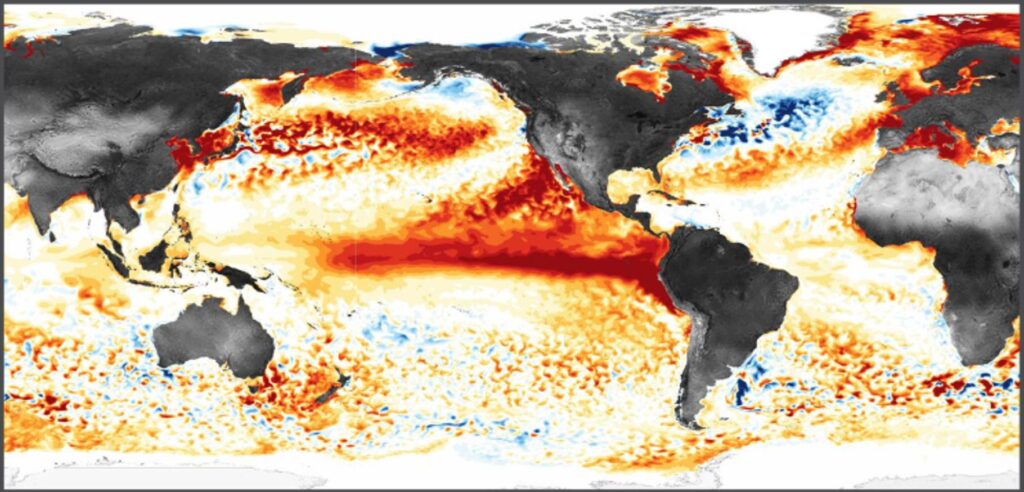
1. Ocean temperature trends – This year’s El Niño is occurring amongst record high average ocean temperatures worldwide (Figure 6). In past decades, the El Niño signature was easier to differentiate from its surroundings, which drove what we think of as the “classic” pattern. Without a significant difference between El Niño and its surroundings, however, the ability of a coupled ocean/atmosphere to move energy and mass where it needs to go on the globe is hampered.
Figure 6 - Global Sea Surface Temperature Anomalies, June 2026 (https://marine.copernicus.eu/press/press-releases/persistent-ocean-warmth-and-expanding-marine-heatwaves-mark-first-half-2026)
2. Related to the rise in global average sea surface temperatures, a group of scientists recently determined that a warming trend spread throughout the entire Pacific Basin (“Pacific Pan-Basin Warming”) correlates strongly with regional SSTAs. In a recent article in the journal Nature (https://www.nature.com/articles/s41558-025-02482-z) they make a case for this basinwide signature as a primary driver for SSTAs, especially in the past 12 years. This phenomenon would also make the El Niño signal harder to discern.
3. The picture is further complicated by a phenomenon called the Madden-Julian Oscillation (MJO). Currently active, the MJO is an eastward traveling low/high pressure system that arises in the Indian Ocean off the coast of Africa. Unlike El Niño, the MJO does not stand still. It’s a short-lived system of intra-seasonal variability that circumnavigates the globe on roughly a 30- to 60-day cycle.
The MJO matters because, depending on its position, it has the power to either suppress or enhance atmospheric convection in the Eastern Equatorial Pacific. As it enters the Pacific from the west, the downward flow on its eastern end can counteract or even temporarily cancel El Niño (in this case: its “destructive phase” with respect to El Niño).
On its journey east, however, the upward convection typical of the MJO may eventually overlap with the convection caused by El Niño (the “enhancing” phase), charging the atmosphere over the Eastern Pacific with heat and moisture.
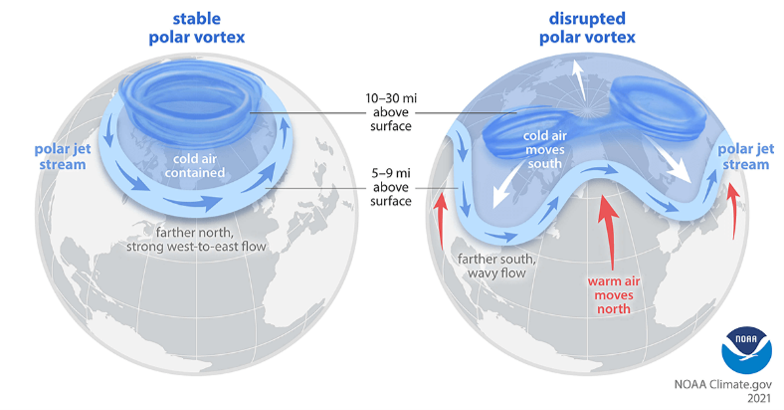
4. Changes in the Polar Vortex also have the potential to wreak havoc on the jet stream. The Polar Vortex is a circular band of winds in the stratosphere (the extreme upper atmosphere, far above the zone where weather that affects Earth’s surface is typically generated). Normally, the Polar Vortex flows counterclockwise in a tight, well-organized (i.e. “strong”) manner (Figure 7).
Figure 7 – The Polar Vortex in its “strong” and “weak” phases(https://www.climate.gov/news-features/understanding-climate/understanding-arctic-polar-vortex)
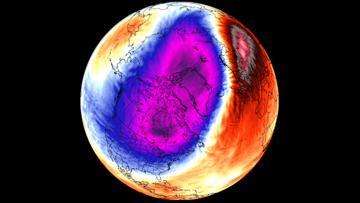
Occasionally, however, it weakens and breaks down, as it did in January/February of 2026 (Figure 8), causing Arctic air to reach as far south as Central America and Southeastern US.
Effects were felt as late as April in the Eastern US, as a late spring core of the vortex migrated south, causing unseasonably cold temperatures along the East Coast.
Figure 8 – The Polar Vortex in late January/early February 2026. Arctic air mass shown in pink and purple. (https://www.severe-weather.eu/global-weather/new-stratospheric-warming-january-2026-polar-vortex-disruption-cold-united-states-canada-europe-fa/)
In summary, a “classic El Niño” is not what it used to be. And even a “Super El Niño” can still be complicated by what is increasingly becoming the new normal. Warmer-than-average global oceans have taken the edge off the El Niño signal in the Pacific in past years and have disrupted the typical movement of energy and mass in the atmosphere, making it harder for El Niño to deliver on its promise of precipitation to the Southwest US. Add to that the potential complications caused by the MJO and an increasingly unpredictable Polar Vortex and we can expect to see some continued swings in the paradigm.
What does this mean for the Colorado River Basin?
During those periods of time when the MJO is in its “enhancing phase,” with respect to El Niño: we can expect more precipitation in the Southwest U.S. (in the Lower Colorado Basin, certainly, but … how far north into the Upper Basin this might extend is anyone’s guess).
Apart from that, the other complicating factors make it almost impossible to say whether or not El Niño will have a beneficial effect on this year’s snowpack. So far, these factors have kept the snowpack below average.